Can AI Forecast Construction Costs? Ours Had to Pass a Blind Test First
Back to InsightsEvery early-stage construction estimate rests on an assumption about inflation that rarely gets examined. We built a cost intelligence tool for a Quantity Surveying consultancy working across Ireland, the UK and Germany, and added an AI model to forecast construction prices. Before anyone could rely on it, we made the model sit a blind test against seven years of published data. The results were more useful than a clean win would have been.
The question behind every concept-stage estimate
Long before there are drawings, a developer asks a Quantity Surveyor (QS) a deceptively simple question: what will this cost? At concept stage the answer comes from benchmarking. The QS finds comparable completed projects, expresses their cost per square metre of gross internal area (GIA), and adjusts for the differences: location, specification, scale, procurement route and time.
Time is the slippery adjustment. A hotel that completed in 2021 was priced in a different market. Its costs have to be escalated to today's prices, and then forward to the date the new project will actually go to tender. In practice, that escalation often comes from a tender price index, a house rule of thumb or a senior consultant's experience. Much of a firm's most valuable knowledge, years of cost plans and final accounts, sits in spreadsheets and people's heads rather than in anything that can be queried.
The brief was to show what happens when that knowledge becomes a structured, reusable asset.
What we built
The tool, called Cost Intelligence, is a working demonstrator. A user describes a concept project: asset type, market, GIA, number of units or beds, specification level, procurement route and target year. The engine scores every historic project for similarity, weighting project type at 35%, market at 20%, GIA at 15%, specification and completion year at 10% each, and procurement route and unit metrics at 5% each. It selects the six best comparables, applies a sequence of visible adjustments, and returns a low, most likely and high range per square metre, together with an elemental cost breakdown, rule-based risk prompts and a confidence score. Reports are saved, shareable by link and downloadable as PDF.
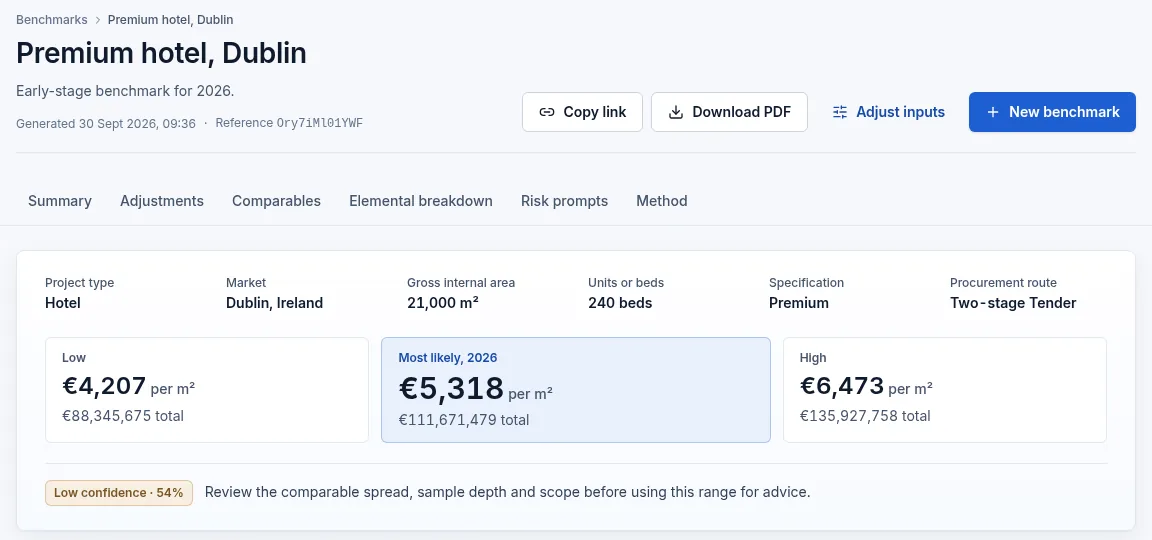
Two design choices shaped everything else. First, every factor is shown with its label, multiplier, value in euro per square metre and a plain-English explanation, because a QS has to be able to defend a number in front of a client. Second, the tool is positioned as evidence for professional judgement, never a replacement for it. The confidence badge in the screenshot is deliberate: when comparables are thin or widely spread, the tool says so before anyone quotes the figure.
The biggest adjustment was the least examined
In the first version, escalation used a fixed assumption: 3.25% a year, or 4% in markets flagged as volatile. In the default hotel scenario, that single assumption was the largest adjustment in the whole bridge, a factor of about ×1.18 worth roughly €733 per square metre. Location, specification and scale adjustments were all smaller.
So the obvious question was whether 3.25% was right. Construction has just been through one of its sharpest price shocks in decades, driven by post-pandemic demand, energy prices and materials supply. A flat rate is unlikely to have tracked it.
Step one needed no AI at all
Before reaching for a model, we loaded the public record: 16 construction price indices from Eurostat, Ireland's Central Statistics Office, the UK's Office for National Statistics and the Department for Business and Trade. That covered output prices (what contractors charge, the closest public proxy for tender prices) and materials prices for steel, concrete, timber, electrical fittings, HVAC equipment and insulation. Then we compared what actually happened with what the fixed rule assumed.
| Market | Published index | Fixed 3.25% a year | Fixed 4% a year |
|---|---|---|---|
| Ireland (to Aug 2026) | ×1.258 | ×1.180 | ×1.225 |
| United Kingdom (to Jun 2026) | ×1.272 | ×1.173 | ×1.217 |
| Germany (to Q2 2026) | ×1.403 | ×1.173 | ×1.217 |
For a comparable completed in 2021, the fixed rule understated escalation by between 3% and 20%, depending on the market. Germany is the extreme case: prices rose 40% while the rule assumed 17%. Switching the backward-looking part of escalation to published indices moved the hotel's escalation factor from ×1.18 to ×1.217, about €140 per square metre more. Across 21,000 m², that is close to €3 million on a single sandbox estimate, before any forecasting.
Key insight
The largest accuracy gain in the project came from using data that was already published. If your escalation for completed comparables still runs on a fixed annual rate, that is the first thing to fix, and it needs no machine learning.
Then the AI: a foundation model for time series
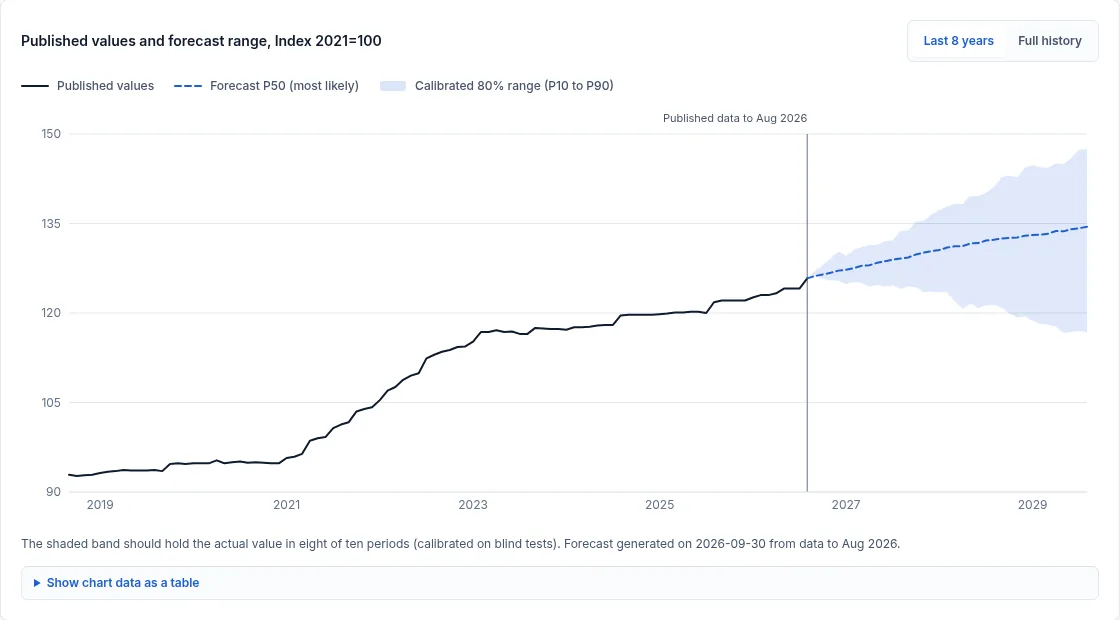
Published indices stop at the latest release. Beyond it, between today and the tender date, you need a forecast. For that we used TimesFM 2.5, Google Research's 200-million-parameter foundation model for time series. Like a large language model, it is pre-trained on a vast range of series and forecasts new ones "zero-shot", without training on our data. It returns a most likely path (P50) and a range (P10 to P90) rather than a single line.
Two practical decisions mattered as much as the model itself. Licensing: TimesFM 2.5 is released under Apache 2.0, while the newer 3.0 carries a non-commercial licence that rules out client deliverables, so we chose 2.5 on purpose. Reliability: the model runs as a separate Python service that needs about 2 GB of memory at peak. The benchmark engine never calls it live. It reads forecasts that are published as versioned files and refreshed monthly, and falls back to the fixed assumption if no forecast exists. A cold or unavailable model can never break a benchmark in front of a client.
The blind test
A forecast you can't check is an opinion. So we ran a rolling-origin blind test: we cut each series at 23 points, every three months from December 2019, let the model forecast the next 12 months without seeing them, and scored the forecast against what was later published. Two simple baselines ran alongside it: "no change", which holds the last value flat, and the existing fixed 3.25% rule.
| Output price index | TimesFM | No change | Fixed 3.25% | Ensemble |
|---|---|---|---|---|
| Ireland | 1.97% | 2.48% | 1.83% | 1.76% |
| United Kingdom | 2.16% | 2.68% | 1.64% | 1.81% |
| Germany | 2.41% | 4.06% | 2.45% | 2.32% |
| UK private commercial | 2.09% | 2.39% | 1.45% | 1.66% |
| UK new housing | 2.18% | 2.98% | 1.81% | 1.87% |
Three findings came out of it, and none of them was "the AI wins":
- The model consistently beat "no change". It picks up trend and momentum that a flat line can't.
- On its own, it mostly did not beat the fixed drift. Only in Germany did it edge ahead, 2.41% against 2.45%. From 2019 to 2026, construction prices mostly rose steadily, and the 3.25% rule had been chosen by people who had lived through that period. On UK series especially, the rule of thumb was hard to beat.
- Averaging the two worked best overall. An ensemble of TimesFM and the fixed drift had the lowest error for Ireland and Germany and stayed close to the best elsewhere. That ensemble is what the tool now publishes.
Averages also hide things. Broken down by period, the Irish record shows an ensemble error of 1.72% for cutoffs in 2019 and 2020, 3.08% in 2021 and 2022, and 0.73% from 2023 onwards. The post-pandemic shock is where every method struggled, and "no change" fared worst at 4.65%. The tool now publishes accuracy by period, so nobody mistakes a calm-market average for performance in a shock.
Honest ranges are harder than honest averages
For a QS, the range matters more than the central line. "Most likely +2.7%, but plan for anything between −1.4% and +6.4%" is advice you can build a contingency around. TimesFM's raw 80% band, however, contained the actual outcome only 66% to 74% of the time on most output price series. It was overconfident.
We widened the band using the blind-test errors, which brought coverage to 80%. Then a director-style review of our own work caught a subtle flaw: the coverage was 80% by construction, because the widening had been fitted on the same tests it was scored against. We changed the method so that each cutoff is scored with a range fitted only on earlier, fully published tests. That is the only fair way to claim a range works.
Tested that way, the Irish band held the actual value in 98% of 192 later periods. It is wider than it needs to be in calm markets, and the tool says so. A slightly conservative range a QS can trust is worth more than a tight one that fails when it matters.
What this changes for a QS practice
- Escalation becomes evidence, not a house number. Each benchmark shows which index escalated which comparable, how much of the factor comes from published data and how much from forecast, and links to the source, licence and method.
- Risk prompts follow the data. A new rule flags any benchmark whose escalation depends on a forecast with a wide range, and recommends testing the low and high escalation cases before advising a client.
- Firms can test before they trust. Users can upload their own cost series as a CSV and run the same blind test on it. Files are processed in memory and never stored.
- Cost history becomes an asset. Once a firm's completed projects are structured, every new estimate draws on all of them rather than the handful a consultant remembers.
Just as important is what it deliberately doesn't do. It doesn't produce a certified cost plan. It uses machine learning only where the blind test showed it adds value, in market escalation, while comparable scoring and risk rules stay as transparent, auditable heuristics. And until a firm loads its own records, the historic projects are plausible sandbox data, labelled as such.
How it was delivered
The first working version, with the benchmark engine, risk engine, executive interface and historic project explorer, was built in two days in May 2026 and deployed to a review URL the same week. The forecasting layer followed in a focused sprint at the end of September, alongside the blind tests, a redesign around task flows, personal access codes with usage records and an in-app help centre. Every significant decision, including the ones that reversed earlier decisions, is recorded in a decision log in the repository.
The most useful thing the AI model did in this project was lose, honestly, to a rule of thumb, and show exactly when and by how much. That is the kind of evidence a Quantity Surveyor can put in front of a client.
The stack
- Web: React 19, TypeScript, React Router, TanStack Query, Recharts and Tailwind CSS 4, built with Vite.
- API: Node.js 24 and Express 5, with Prisma 7 on SQLite and Zod schemas shared between API and web.
- Forecasting: Python with TimesFM 2.5 (200M, Apache 2.0) on CPU-only PyTorch, served by FastAPI, plus an ingestion pipeline for public indices.